Projects using NeuLog sensors and AI
04/09/2025
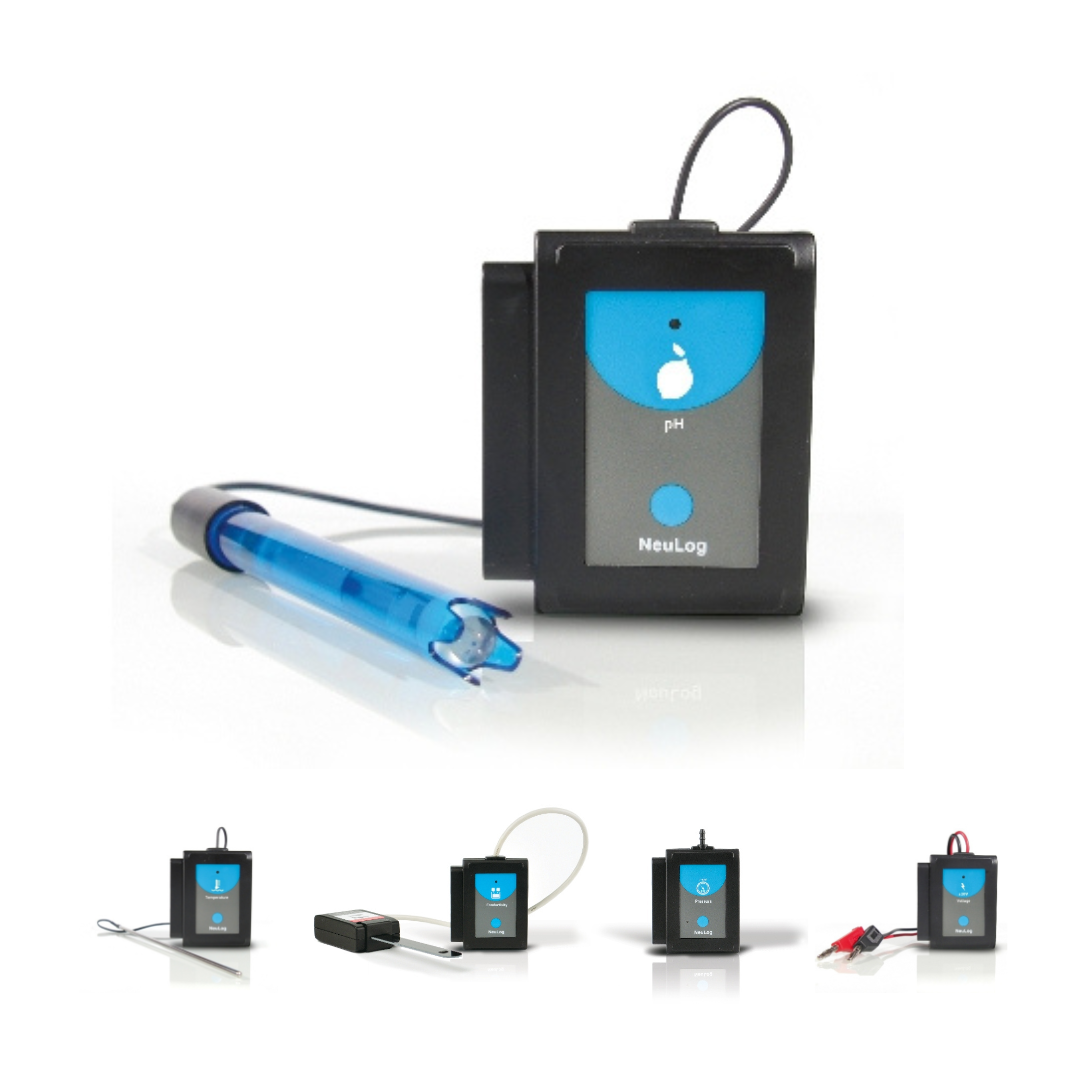
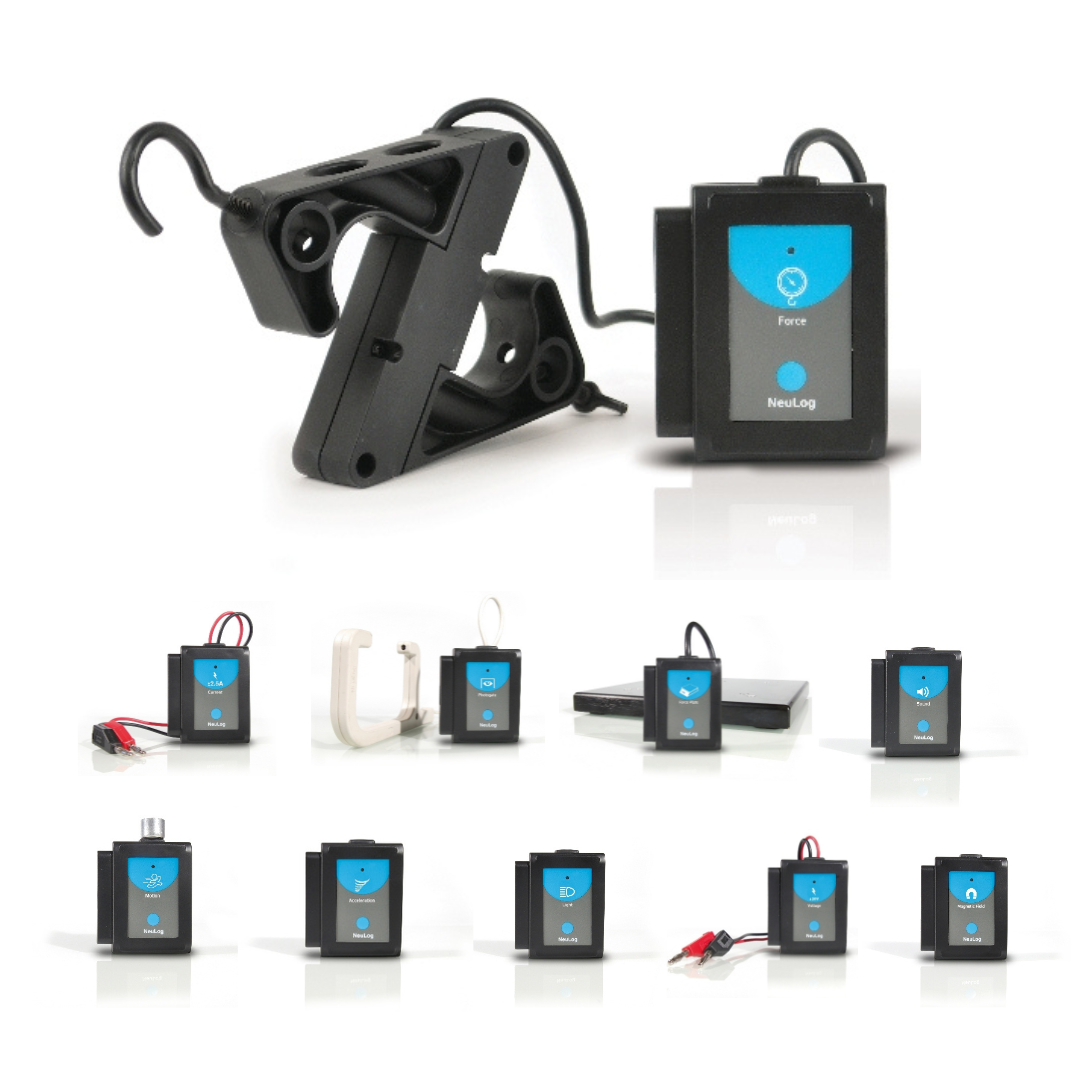
One of NeuLog’s most notable advantages is the ability to perform an experiment with multiple sensors synchronized to each other, even connected wirelessly by Bluetooth to any computer platform.
Another unique advantage of NeuLog, is the ability to use multiple sensors of the same type in an experiment. NeuLog enables the use of up to nine sensors of the same type in an experiment.
A simple way to work with AI is to run a research experiment with NeuLog sensors, save the data in an Excel file, and then ask ChatGPT to analyze the results.
Here is an example of a dialog with ChatGPT about photosynthesis.
You said:
I have small greenhouse with temperature, oxygen and CO2 sensors.
I have measurements of these sensors for 7 days.
What analysis I can get from you?
ChatGPT said:
Great — with 7 days of data from temperature, oxygen, and CO₂ sensors in your greenhouse, there are several useful analyses we can perform to help you understand your system and optimize plant growth. Here’s a breakdown of what I can offer:
- Data Cleaning and Summary Statistics
Detect missing or abnormal values
Daily averages, minimums, and maximums
Summary trends: Are temperature or CO₂ levels consistent? Is oxygen dropping at night?
- Time Series Analysis
Plot trends over time (hourly/daily patterns)
Detect diurnal cycles (e.g., does CO₂ rise at night when photosynthesis stops?)
Identify anomalies or events (e.g., heat spikes, ventilation failures)
- Correlation and Interaction Analysis
How does temperature affect CO₂ or oxygen?
Check correlations:
Does higher temperature reduce CO₂ faster?
Is oxygen increasing during daylight (photosynthesis)?
Visualize relationships using scatter plots or correlation matrices.
- Photosynthesis Insights
If your plants are active photo synthesizers (e.g., tomatoes, lettuce), we can:
Estimate photosynthetic activity from O₂ and CO₂ patterns
Compare day vs. night gas exchange
Suggest optimal CO₂ ranges and timing for injection (if you control it)
- Machine Learning or Predictive Modeling (Optional)
With just 7 days, ML models are limited, but we could:
Build simple models to predict CO₂ or O₂ based on temperature
Cluster periods into “high activity” vs. “low activity” days
Start training a model to recommend optimal conditions
- Optimization Suggestions
Based on the analysis, I can:
Suggest temperature or CO₂ levels that correlate with higher O₂ (photosynthesis proxy)
Recommend ventilation, CO₂ injection, or shading schedules
What I need from you:
Please upload the sensor data — preferably in CSV or Excel format, with timestamps and columns like:
timestamp, temperature, CO2_ppm, oxygen percent
Once I have the file, I can:
Run the full analysis
Generate graphs
Give you actionable insights
Here’s a quick checklist to help you format it properly:
Recommended File Format: CSV or Excel
Example file name: greenhouse_data.csv or greenhouse_readings.xlsx
Column Structure
Make sure your file has a header row, like this:
timestamp temperature CO2_ppm oxygen percent
2025-07-10 08:00:00 26.5 480 20.5
2025-07-10 09:00:00 27.0 450 20.6
... ... ... ...
timestamp should include both date and time (hourly preferred)
Units:
Temperature in °C
CO₂ in ppm (parts per million)
Oxygen in % (e.g., 20.9 for normal air)
Optional columns (if available):
If you have other sensors or notes (e.g., light intensity, humidity, fan on/off, etc.), include them as extra columns.
Once the file is ready:
Upload it here.
I’ll immediately start the analysis and show you insights with visuals.
Let me know if you need help cleaning or formatting the file too — I can guide you step-by-step in Excel or any tool you're using.
Photosynthesis research steps
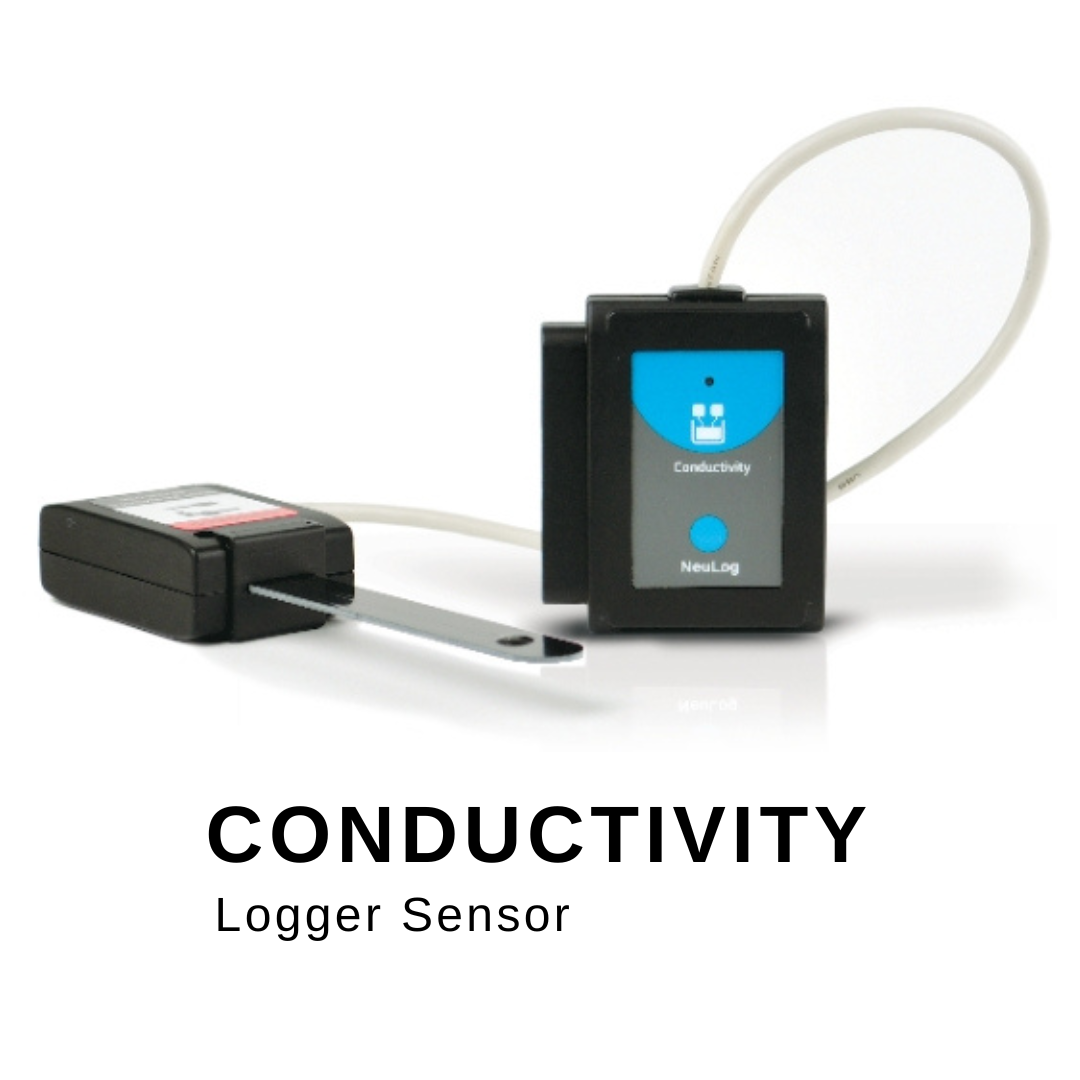
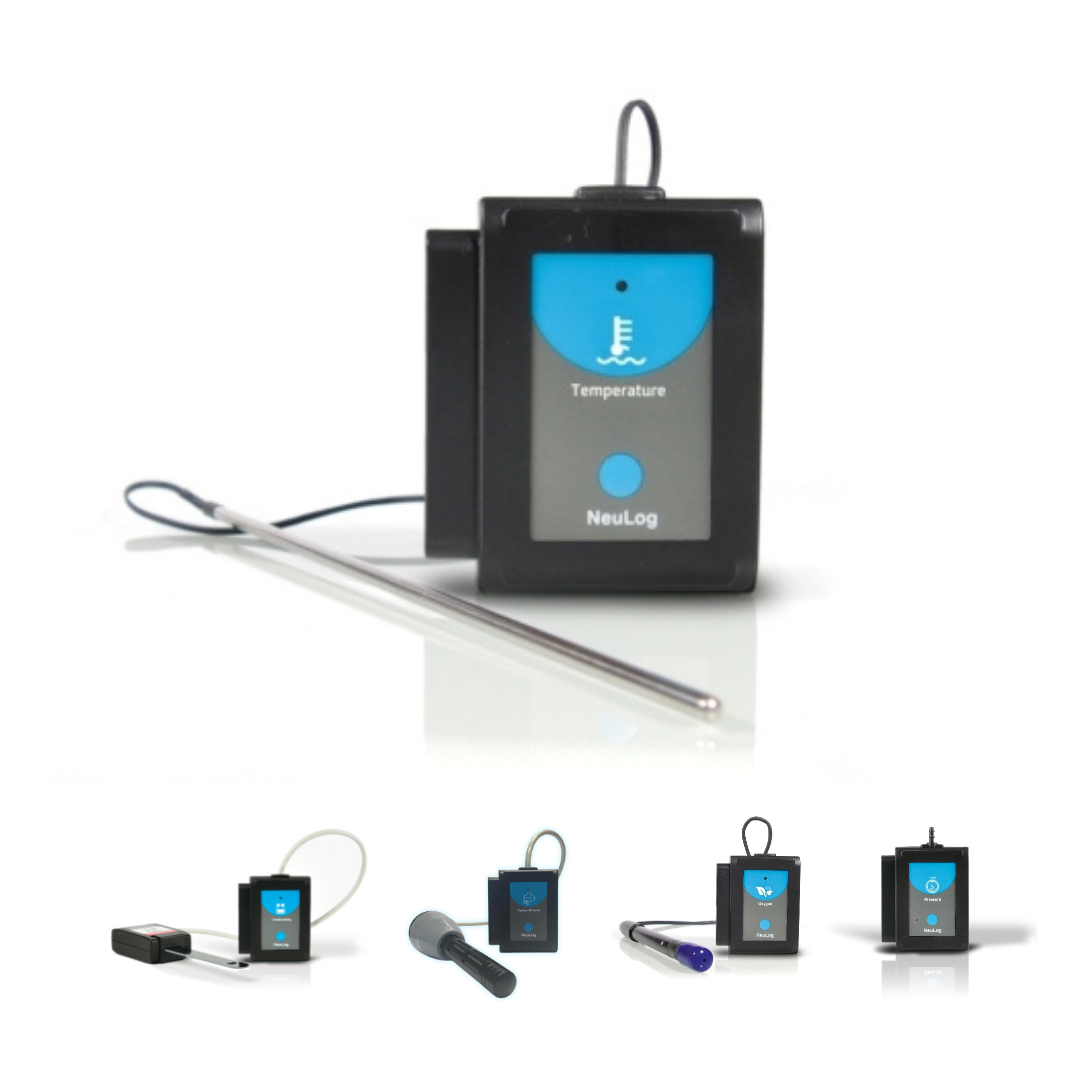
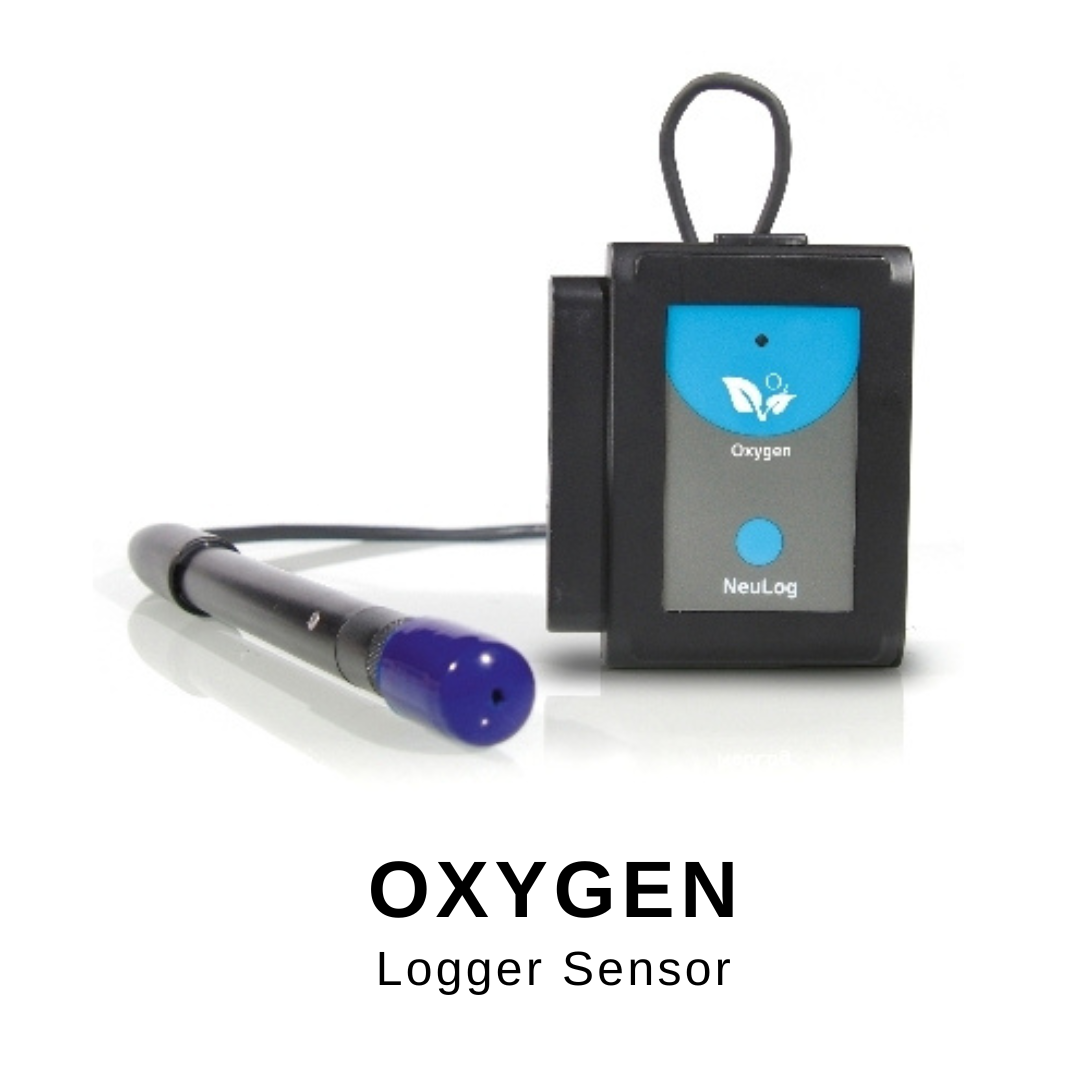
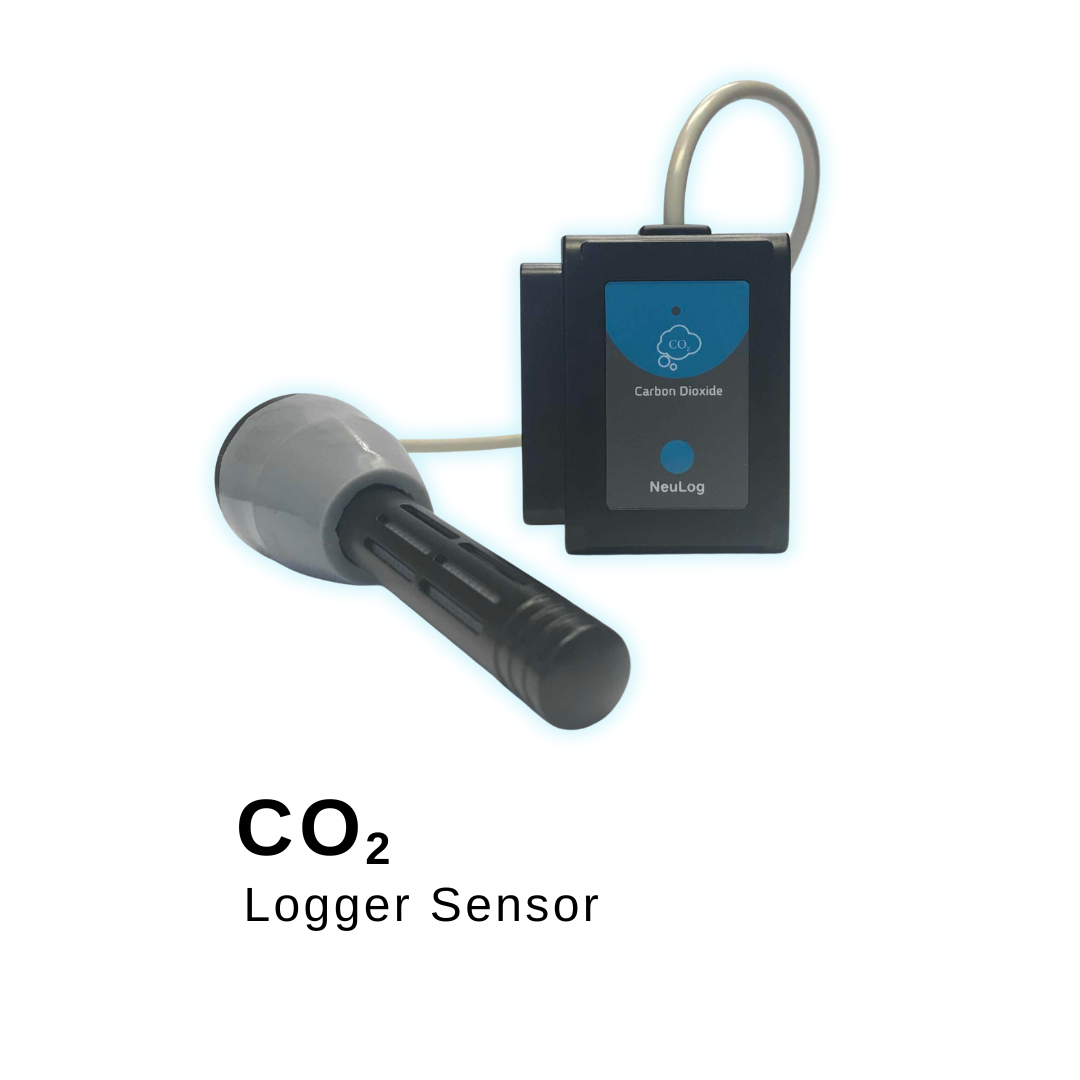
- Install NeuLog's CO2, oxygen, and temperature sensors connected to the Bluetooth module in one chamber of the Ecolog kit and a pot with a plant
- Ensure the possibility of watering the plant
- Ensure electricity for the Bluetooth module
- Run the experiment for at least a week (preferably longer)
- Export the data to an Excel file
- Contact ChatGPT and ask them to analyze the data as described above.
More research examples
The following experiments were done by high school students, but without ChatGPT help.
Better sail design
- Prepare a model of a boat with a sail.
- A powerful fan is installed in back of the board.
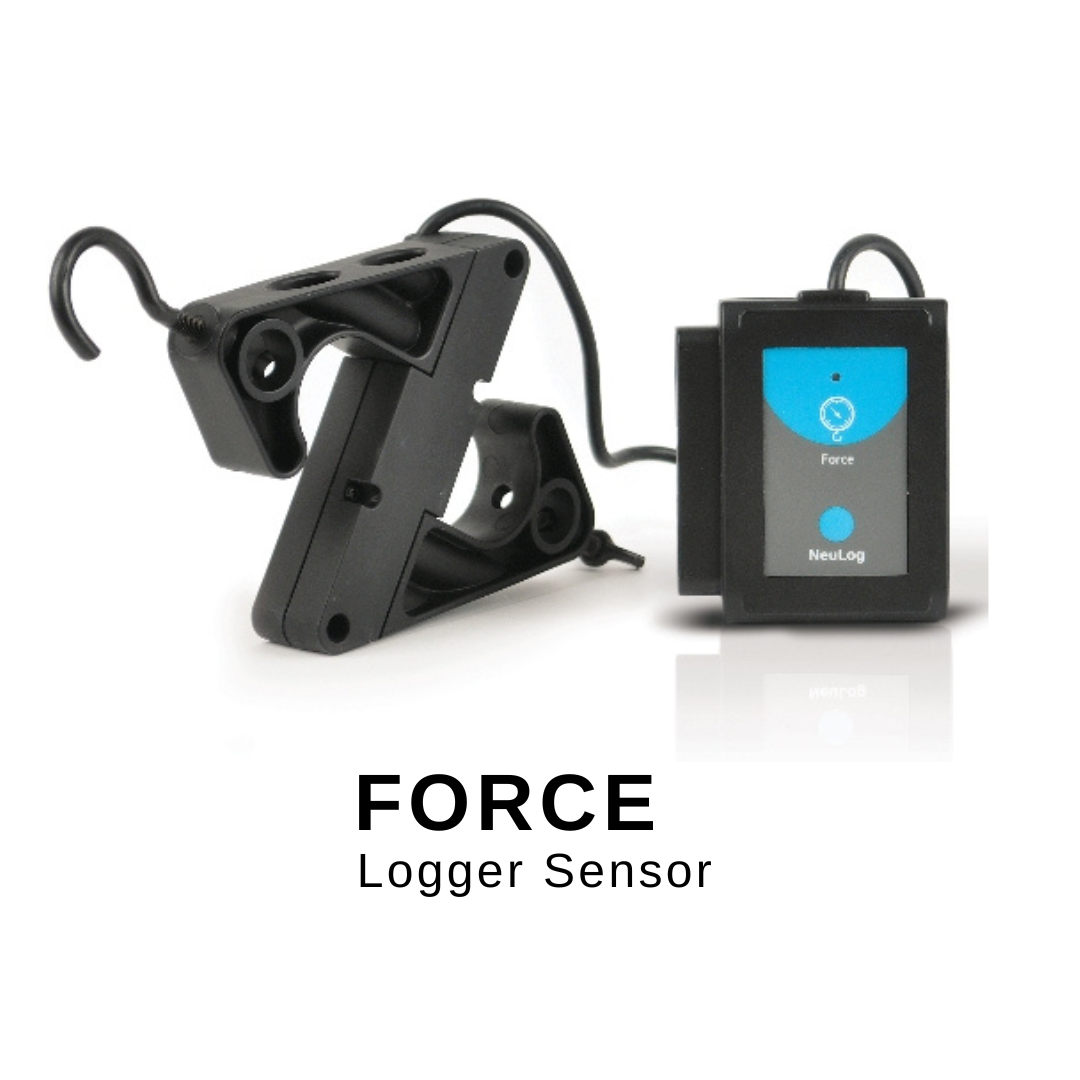
- The boat is connected to two force sensors to measure the force vectors acting on the boat: the force along the boat (which represents its speed of progress) and the force on the side of the boat (which represents the degree of friction of the boat in the water).
- The boat sail is connected to an angle sensor that shows the angle of the sail relative to the boat body (zero angle indicates that the sail is parallel to the boat body)
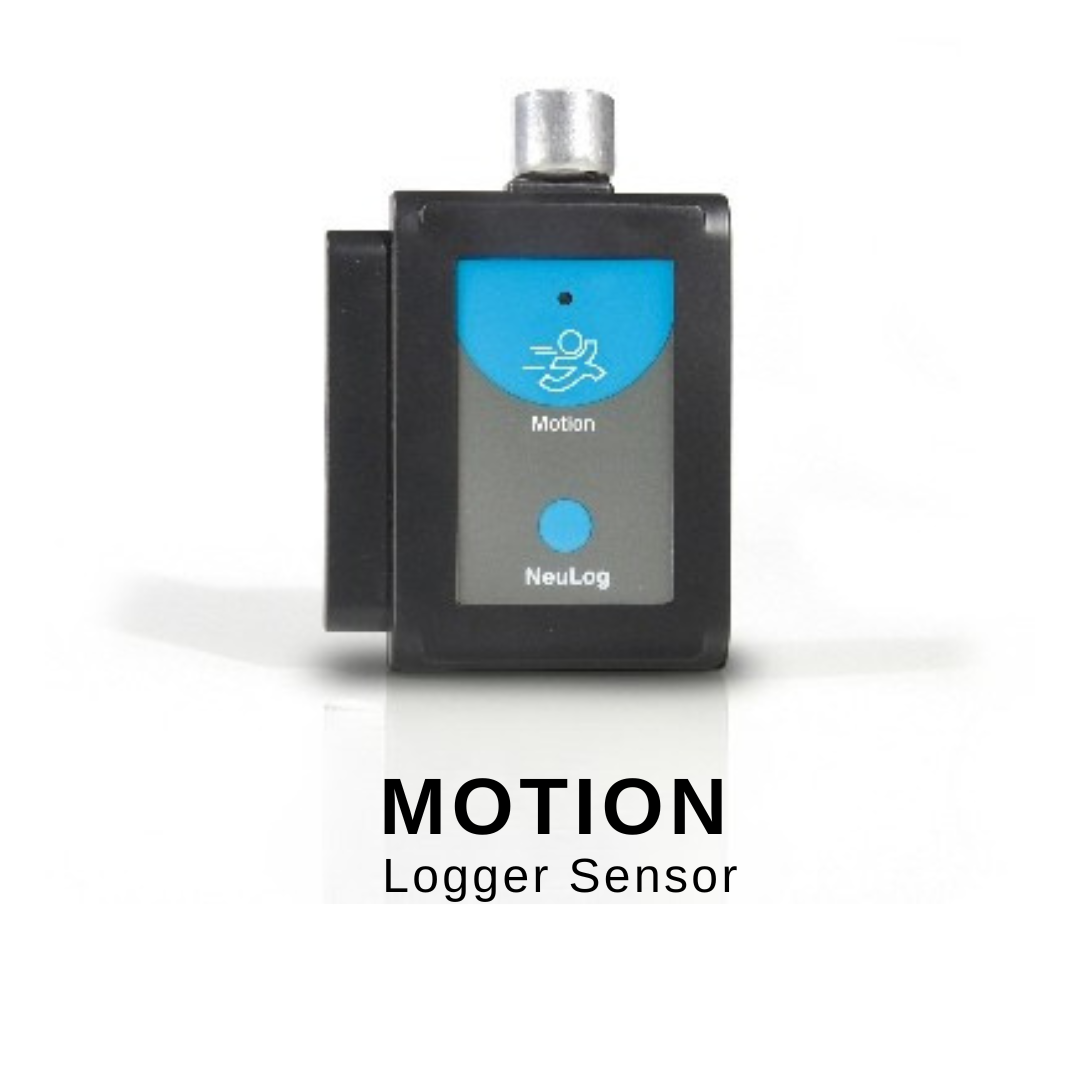
- Another angle sensor shows the direction of the boat relative to the fan.
- Run an experiment that samples and saves the forces and angles.
- Change the boat and the sail angles to the wind direction.
- Save the results of the experiments in Excel sheets
- After completing the test, replace the sail with another sail and repeat the process.
- Transfer the data to GPT, which will find which sail has the best quality.
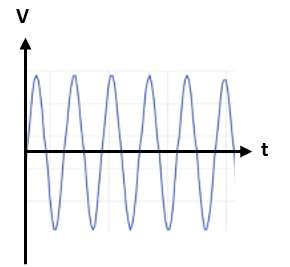
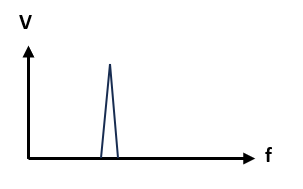
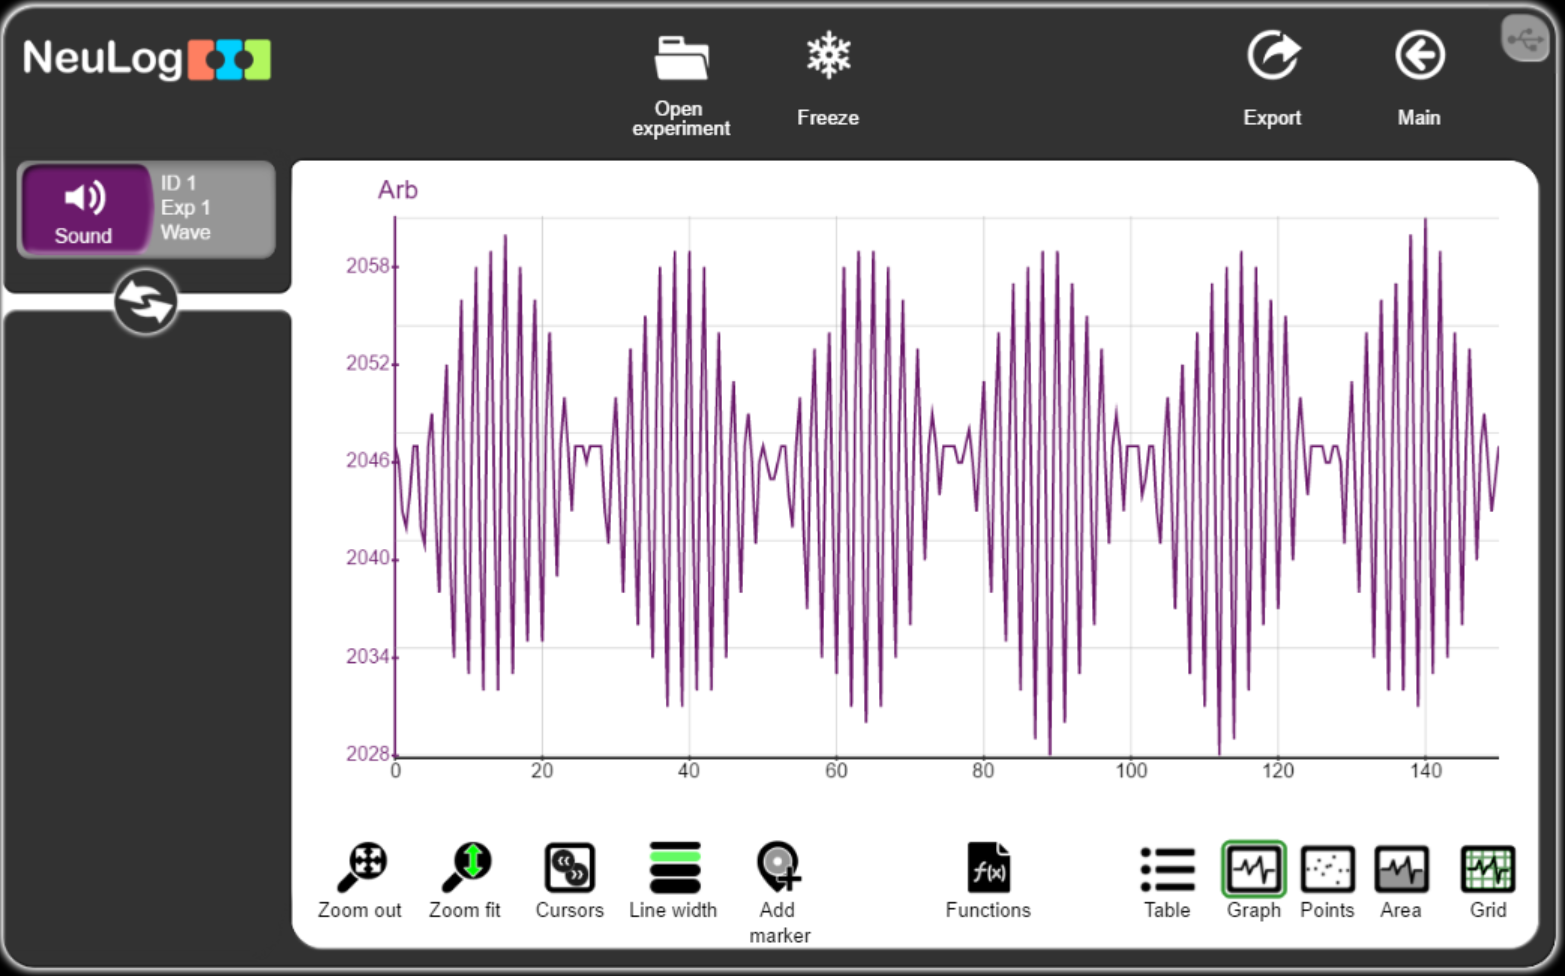
Acoustics test
- Distribute five sound sensors in a room
- Make a loud sound or play a loud music near one of the sensors
- Export the data to an Excel file
- Send the data to GPT and ask it to analyze the acoustics in the room and to recommend improvements.
You can ask ChatGPT for additional ideas for research experiments to be carried out with certain sensors.
In the next post we shall share such dialogs with ChatGPT.
The NeuLog system enables the creation of Machine Learning Systems, and we shall describe that later using the NeuLog API software.