Sound experiments
04/08/2025
Our goal is to ensure that students do not experience failure. We aim to support teachers by providing lesson plans that keep students attentive and help them understand and retain complex material. This includes detailing the procedure step by step, demonstrating expected results, and guiding students through their analysis.
In sound experiments, mathematics plays a crucial role in analyzing measurements and graphs, helping students gain a deeper understanding of sound principles. As we always emphasize—mathematics is the language of science.
The sound experiments require the following set:
BLT-202 USB/Bluetooth communication module
NUL-212 Sound logger sensor
The sound lesson plans can be found in Physics experiment page in this site.
The sound videos can be found in Experiment videos page in this site.
The lesson plan Exploring sound covers how to measure different intensities of sound, what is the meaning of sound units (dB) and why it is used, different levels of sound intensities and the concept of sound isolation.
Speed of sound video
This video shows how to measure the time delay between the two sound sensors and calculating the speed of the sound in air.
The lesson plan Speed of sound, describes how to measure the speed of sound. In this experiment we use two sound sensors in distance between them, clapping hands near one of them and measuring the time delay in the graph.
The speed of sound is calculated by dividing the distance between the two sensors by the time delay.
Sound waves video
This video shows the sound waves, how to measure its frequency and how a musical instrument sound looks like.
The lesson plan Sound beats, demonstrates the interference of two sound waves and analyzing the resulting wave mathematically.
Sound Intensity
Sound is a travelling wave that propagates as an oscillation of pressure through solids, liquids, or gases. It consists of frequencies within the range of human hearing and of and at levels strong enough to be perceived.
Sound intensity is defined as the power per unit area. The basic units are watts/m2 or watts/cm2
Sound intensity measurements are made relative to the standard threshold of human hearing intensity at 1000Hz, I0.
The sound levels we hear vary dramatically. For instance:
Whispering is 1000 times louder than the hearing threshold.
Speech in a restaurant is 10 million times louder than the hearing threshold.
A rock concert is 10 billion times louder than the hearing threshold.
The amazing thing is that the human ear is able to distinguish speech at all different levels of intensity and on a logarithmic scale.
Sound intensity is commonly measured in decibels (dB). It is a logarithmic scale, meaning an increase of 10 dB represents a tenfold increase in intensity.
Decibels measure the ratio of a given intensity I to the threshold of hearing intensity, I0.
When I = I0 the sound level is 0dB.
In a quiet room (what is called silence), the sound intensity is 10,000 times the threshold and produces 40dB (10log10[10,000] = 40).
Speed of sound
The speed of sound is the velocity at which sound waves propagate through a medium. Sound waves are mechanical longitudinal waves generated by pressure variations in a medium, which the human ear perceives as sound.
The speed of sound experiment utilizes two sound sensors to measure the propagation of sound through air. By placing the sensors in a known distance apart and generating a sharp sound (such as a hand clap), we can determine the time difference between the signals received by each sensor.
Sound waves
Key properties of sound waves are:
Frequency (f): The number of complete cycles per second, measured in Hertz (Hz).
Period (T): The time taken for one full cycle, measured in seconds.
In this activity, we will use a sound logger sensor to measure the period and frequency of sound waves produced by three tuning forks with different lengths.
A sound signal is sine signal according to the following formula:
A(t) = Asin(2πft)
A represents the amplitude (maximum value) of the signal
f represents the frequency
The following graph describes a sine wave in the time domain:
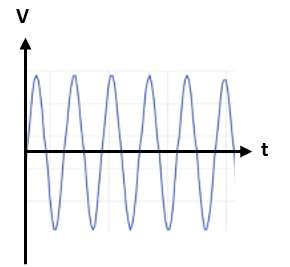
Another way to describe waves is in the frequency domain:
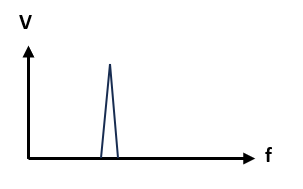
This graph shows the frequency and amplitude of the wave. If the wave is composed of several sine waves, this graph displays them.
Converting a signal to frequency domain is called Fourier Transform. We use this NeuLog function especially to see the side tones of a musical instrument sound.
Sound Beats and Wave Interference
Wave interference is a phenomenon which occurs when two waves meet while traveling along the same medium. When two waves interfere, the resulting displacement of the medium at any location is the algebraic sum of the displacements of the individual waves at that same location.
When two sound waves of nearly identical frequencies interact, they create a phenomenon called beats. Beats occur due to superposition, where two waves combine to form a new wave pattern.
Constructive interference occurs when waves reinforce each other, increasing amplitude.
Destructive interference occurs when waves cancel each other out, reducing amplitude.
This experiment explores how two tuning forks with slightly different frequencies produce beats. The frequency difference between the two forks determines the beat frequency.
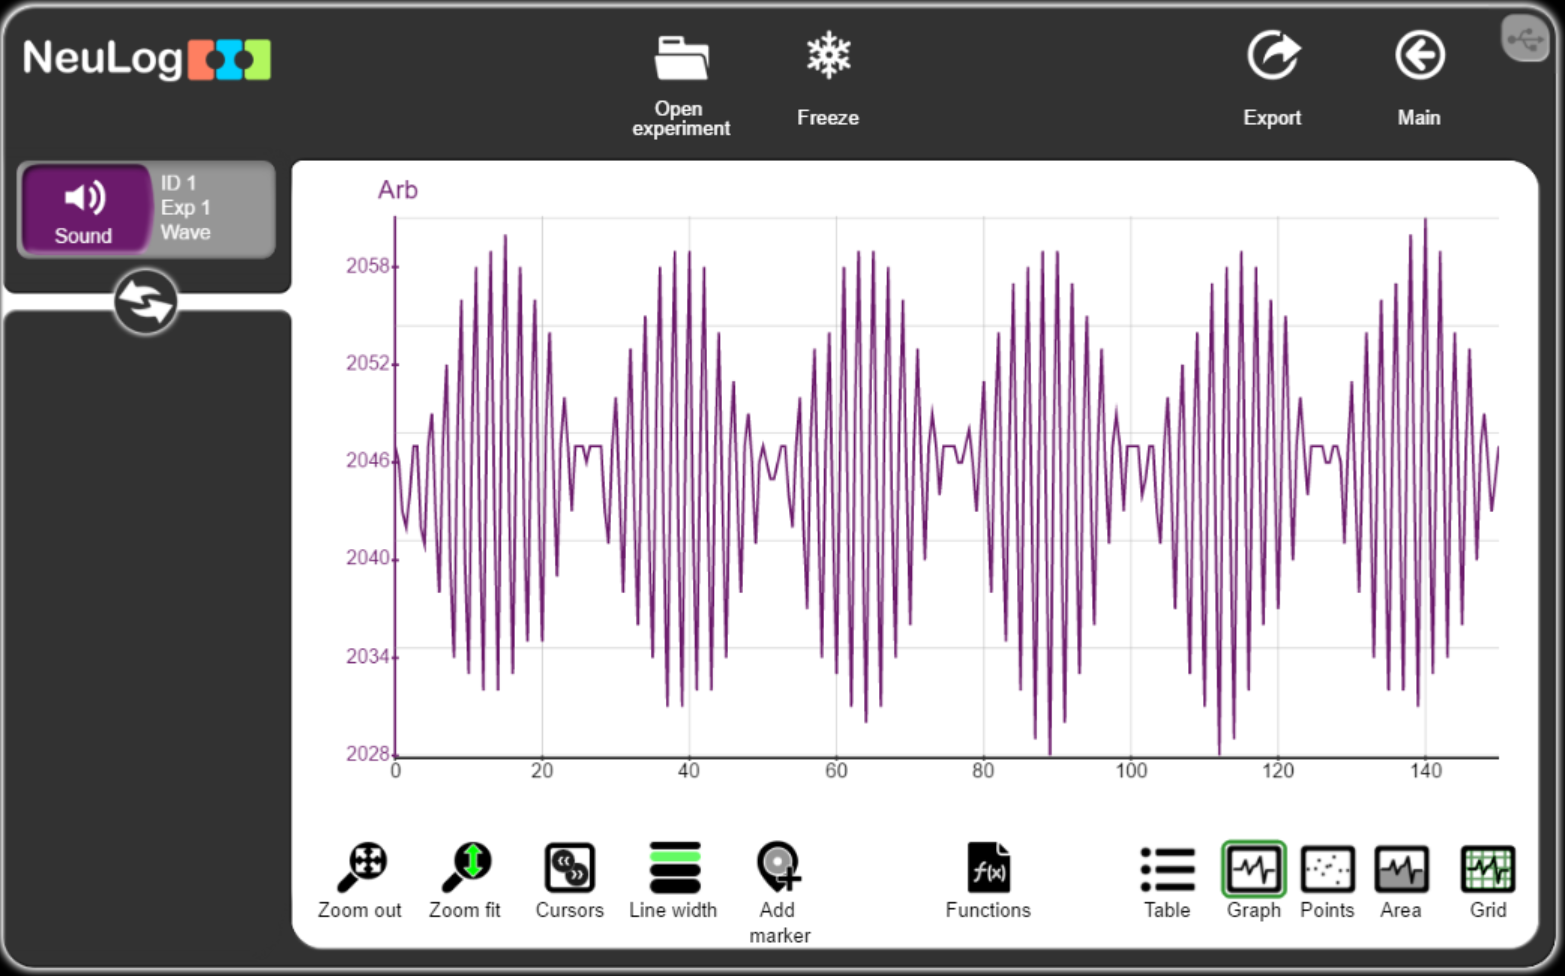
The following signal is the outcome of these two signals.
The Fourier Transform of this beat signal is:
![]()
The beat signal is a sum of two waves:
Asin(2πf1t) + Asin(2πf2t)
We use the trigonometric formula to show that that this sum of two sine waves is equal to a product of two waves:
2Acos(2π(f1 - f2)/2)t)sin(2π(f1 + f2)/2)t)
This is what we call a modulated signal.
The signal frequency is (f1 + f2)/2.
The amplitude is changed according to the frequency (f1 – f2)/2.
More to read – NeuBlog
- Projects using NeuLog sensors and AI
- Basic Sound Set and Sound experiments
- Basic Motion Set and Motion experiments
- Basic pH Set and pH experiments
- Published Research with NeuLog GSR sensor
- Basic GSR Set and GSR experiments
- Basic Heat Set and Heat experiments
- Neuron Logger Sensors
- Coding For Young Students – The Next Big thing
- Most Beautiful Graphs in Physics
- Light sensor brought to light