A little about the Sense unit
|
Dimensions L: 5.6” (14 cm) W: 5.6” (14 cm) H: 1.5” (34 cm) W: 7.65 oz (217 g)
Sensors built in:
|
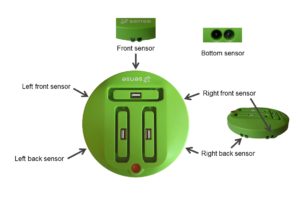 |
What can be added to Sense:
|
|
Dimensions L: 5.6” (14 cm) W: 5.6” (14 cm) H: 1.5” (34 cm) W: 7.65 oz (217 g)
Sensors built in:
|
 |
What can be added to Sense:
|
Sense – First Glance
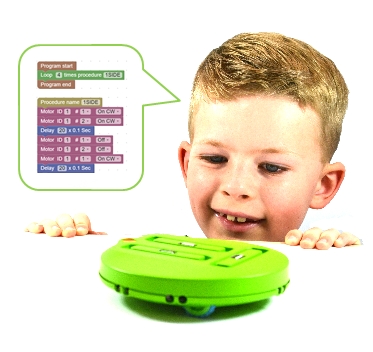
Sense to a Student
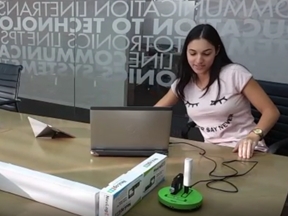
Sense to a Teacher and Parent
|
 |
 |
 |
|
Sense is a robotic and computer programming system which allows users to explore, problem solve, and advance their computer programming abilities from just starting in visual block programming, to Python and C languages. The sense platform can be expanded by over 45 different NeuLog sensors so that you can create solutions and codes the world has never thought of for any problem you try to over come. Students can program the Sense via the “RoblocklySense” programming platform which runs through your browser. |
.
|
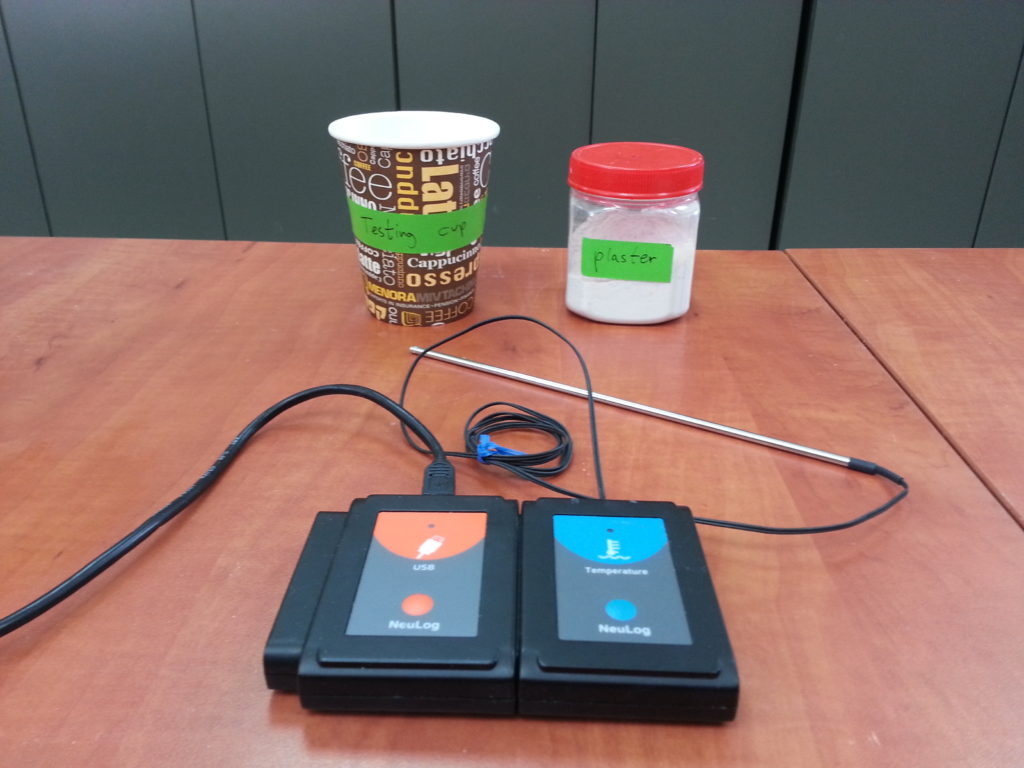
“I teach AP Chemistry at Upper Darby High School, a large, 4000 students, racially and economically diverse school. I won a Google Grant in 2014 and purchased a bunch of Neulog probes; Temperature Logger, pH probe, Colorimeters, etc. The probes are very easy to use. My students were able to easily master them and use them to efficiently collect data. In my room we connect the probes to old PC’s via USB. I have also used the WiFi connection, which works great. However, the best part of the probes is the support that I get from at Neulog. A total winning combination. Great product with even better service!” Chris G. |
 |
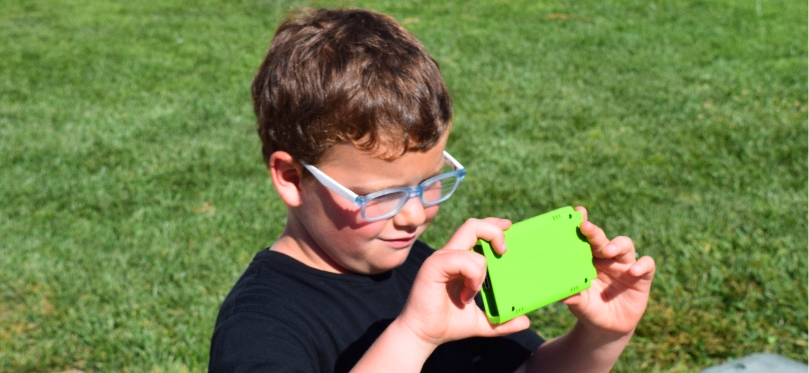
 |
Light at Different Environments S-1 Internal Light sensor |
 |
Relative Humidity at Different Environments S-3 Internal Relative humidity sensor |
 |
Sound Levels S-5 Internal Sound sensor |
 |
Temperature at Different Environments S-8 Internal Temperature sensor |
 |
Barometric Pressure and Altitude S-11 Internal Barometer sensor and internal Altitude sensor |
 |
Magnets S-13 Internal Magnetic field sensor |
 |
Acceleration in Everyday Life S-16 Internal Acceleration sensor |
 |
Dew point and Dew Formation S-19 Internal Dew point sensor |
 |
The Physics of Jumping M-1 Internal Sound sensor and internal Acceleration sensor |
 |
How Low Can you Go M-2 Internal Barometer sensor and internal Altitude sensor |
 |
Ecology Research Project M-3 Several Internal sensors |
 |
Relative Humidity and Dew point M–4 Internal Relative humdity sensor and internal Dew point sensor |
 |
360 Degrees of Light M-5 Internal Magnetic field sensor and internal Light sensor |
 |
Weather Measurements M-6 Internal Temperature sensor and internal Light sensor |
 |
Forms and Sources of Energy M-7 Internal Temperature sensor and internal Light sensor |
 |
Loud and Soft Sounds M-8 Internal Sound sensor |
 |
Light and Shadow M-9 Internal Temperature sensor and internal Light sensor |
 |
Gravity and Motion M-10 Internal acceleration sensor |
 |
Magnetic Field M-11 Internal Magnetic field sensor |
 |
Day and Night Sky M-12 Internal Light sensor |
 |
Pushing and Pulling a Car M-13 Internal acceleration sensor |
|
How to Get Started with the NeuLog Panda |
How to Run Experiments with the NeuLog Panda |
|
|
NeuLog Panda with a Computer |
NeuLog Panda with Tablets and Smartphones |
9/6/2016
Every scientist knows that a nice looking figure can be very efficient in getting your paper published. A lot of NeuLog experiments generate really esthetic and interesting graphs. I gathered the top seven graphs for physics:
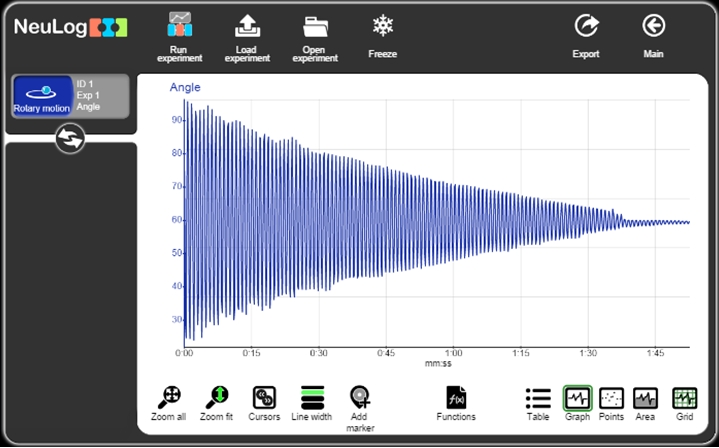
The location of a mass swinging back and forth on a thread was measured by a rotary motion sensor. Friction causes it to have slightly smaller amplitude each swing until decay.
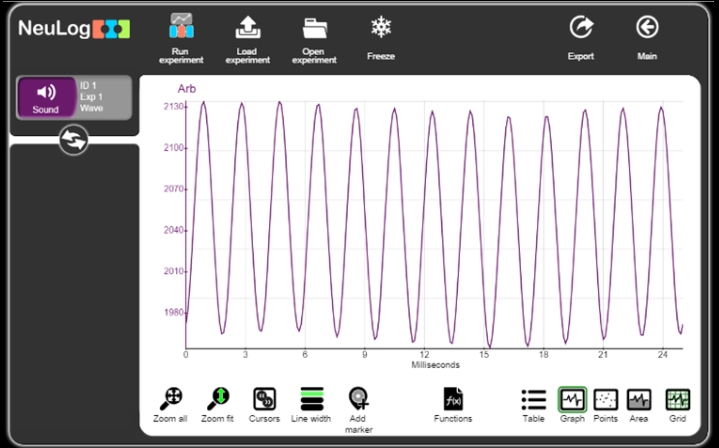
When hit by a hammer, the tines of a tuning fork vibrate back and forth pushing the air molecules around them. When the tine moves forward the molecules are pushed together creating a compression and when the tine moves backward it creates a rarefaction (low pressure region). The compressions and rarefactions were detected by a sound sensor. This created a nice recurring pattern.
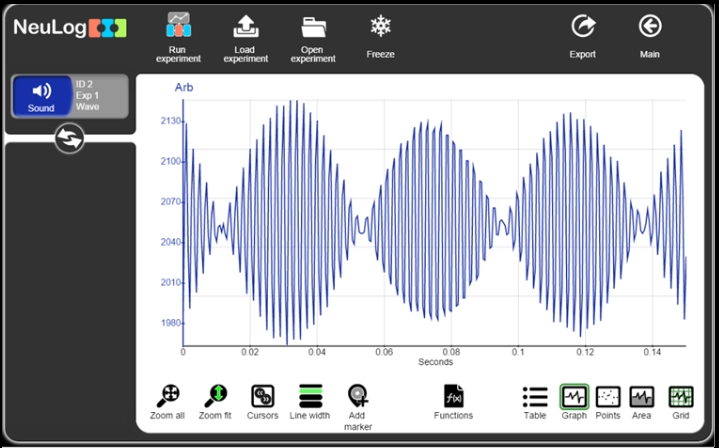
In this experiment, two tuning forks with different frequencies were hit to create a stunning graph that demonstrated wave interference. Wave interference is a phenomenon which occurs when two waves meet while traveling along the same medium. When two waves interfere, the resulting displacement of the medium at any location is the algebraic sum of the displacements of the individual waves at that same location.
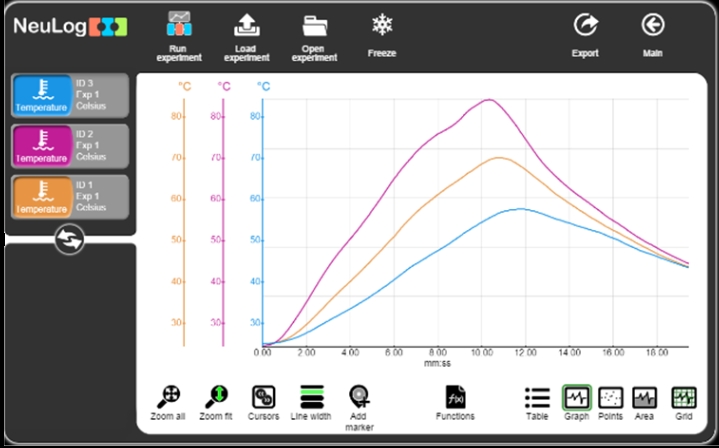
In this experiment, three different metals were heated and then cooled down. Their temperature was measured with the NeuLog Temperature sensor. The composition of the atoms in the material affects how the temperature changes.
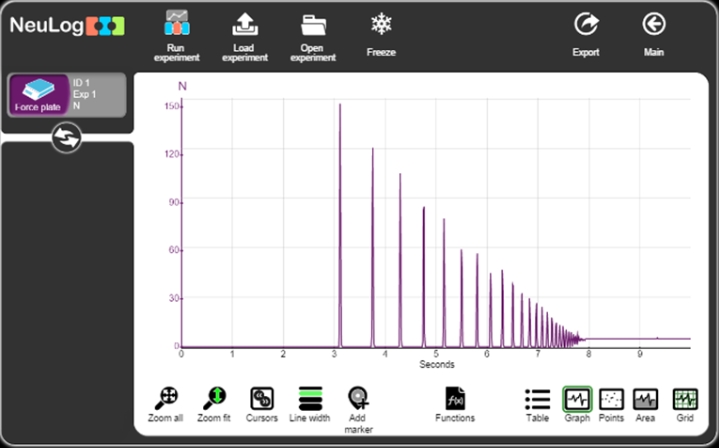
In this experiment, a basketball was dropped on a force plate sensor. The graph shows the force that was applied on it. Impulse and change in momentum values were calculated using this great graph. The interesting thing about this experiment is that not only did the ball height decrease over time, but there was also less time between each bounce.
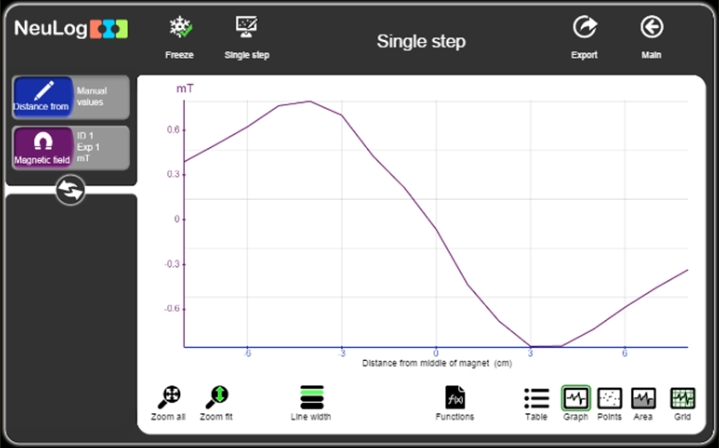
In this experiment, the magnetic field strength was measured at different locations on a bar magnet. This created a graph that has perfect rotational symmetry.
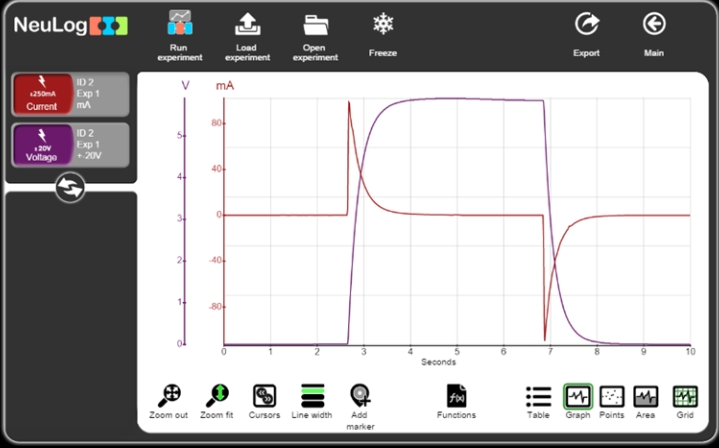
In this experiment, voltage and current were measured while a capacitor was charged and discharged. The current graph also has excellent rotational symmetry.
da ga truc tiep hom nay – câu lô mb – da ga trực tiếp – câu lô mb chot lo to.com cau mb hom nay – du doan mb -cầu lô miễn phí – cầu lô miễn phí – cau mb hom nay
“Data logging has been around in schools for many years. Most data-loggers have functioned in similar forms, with connections via a serial port to a computer and onto a sensor or two. The new Edulogger claims to be the ‘simplest, fastest and most advanced system available’, so was it?” |
|
|
“The computing centre of the suite of sensors is very flexible; any from a tablet, mobile phone or PC can be used as the computational core. The software is either a browser interface or on a PC can be a dedicated piece of software, which is similar in layout. The tablet software is very easy to use. Using a WiFi transmitter, the data can be streamed as part of its own network or integrated into an existing WiFi router. Using its own internal WiFi system is very easy; allow your tablet or computer to access the access point, open a browser and point it to the wifi201.com site and you are off. Once I had found out how to access the WiFi transmitter, the manual was redundant!” |
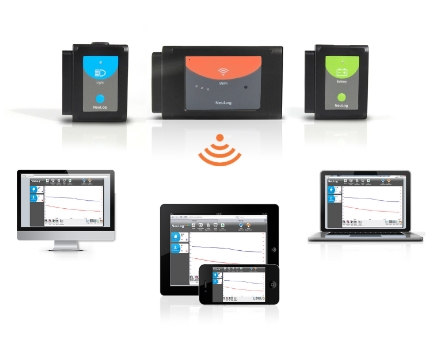 |
The software
“Starting the software with the WiFi bridge in place opens up the welcome screen, which leads onto a screen with the modules installed on the left hand side and data being graphically displayed on the left. By clicking on the sensor icon, the software allows a customisable menu with access to recording times, number of points to be recorded per unit of time and triggers. This is a very impressive line up on a tablet computer.” |
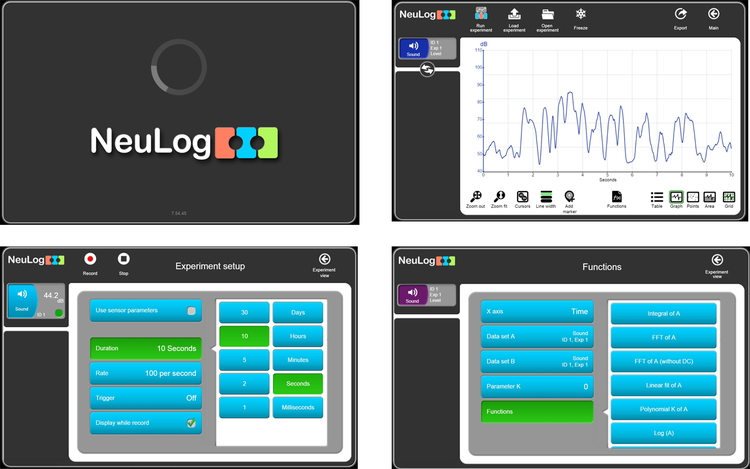 |
In conclusion….
“Overall I would certainly invest in this apparatus myself. The logging speed is indeed impressive as is the general layout of the logging screen and the clever use of a browser type interface.” |
|