Most Beautiful Graphs in Physics
9/6/2016
Every scientist knows that a nice looking figure can be very efficient in getting your paper published. A lot of NeuLog experiments generate really esthetic and interesting graphs. I gathered the top seven graphs for physics:
1. Simple Pendulum
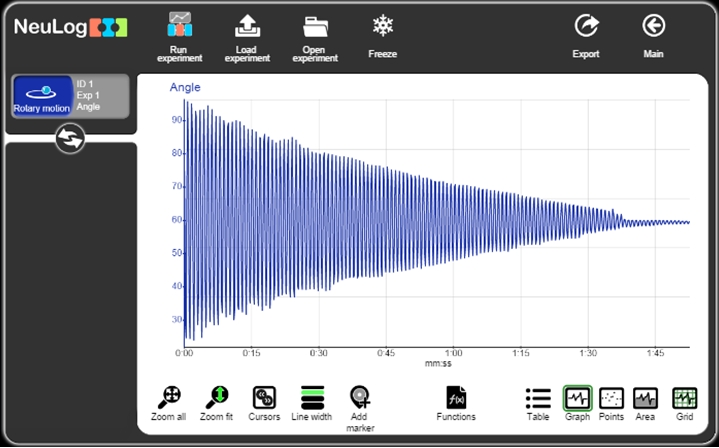
The location of a mass swinging back and forth on a thread was measured by a rotary motion sensor. Friction causes it to have slightly smaller amplitude each swing until decay.
2. Sound Waves
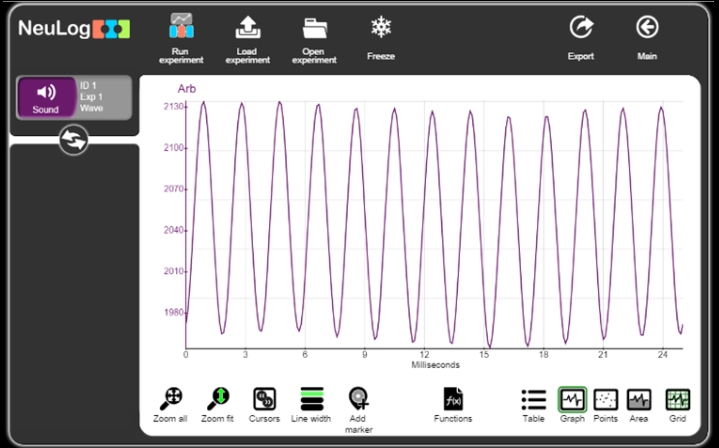
When hit by a hammer, the tines of a tuning fork vibrate back and forth pushing the air molecules around them. When the tine moves forward the molecules are pushed together creating a compression and when the tine moves backward it creates a rarefaction (low pressure region). The compressions and rarefactions were detected by a sound sensor. This created a nice recurring pattern.
3. Sound Beats
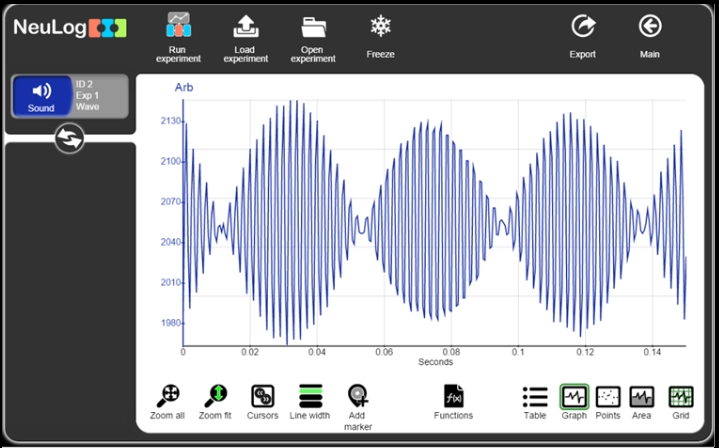
In this experiment, two tuning forks with different frequencies were hit to create a stunning graph that demonstrated wave interference. Wave interference is a phenomenon which occurs when two waves meet while traveling along the same medium. When two waves interfere, the resulting displacement of the medium at any location is the algebraic sum of the displacements of the individual waves at that same location.
4. Thermal Conductivity
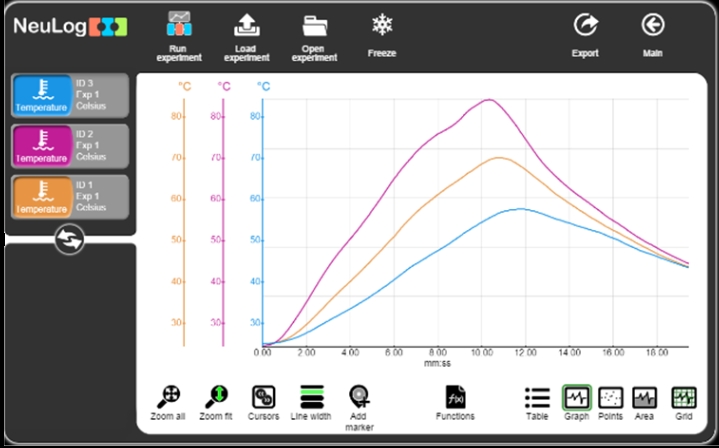
In this experiment, three different metals were heated and then cooled down. Their temperature was measured with the NeuLog Temperature sensor. The composition of the atoms in the material affects how the temperature changes.
5. Impulse and Momentum
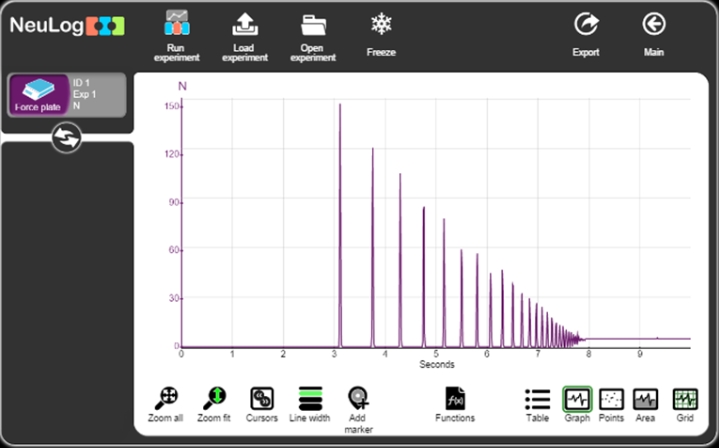
In this experiment, a basketball was dropped on a force plate sensor. The graph shows the force that was applied on it. Impulse and change in momentum values were calculated using this great graph. The interesting thing about this experiment is that not only did the ball height decrease over time, but there was also less time between each bounce.
6. Magnetic Field
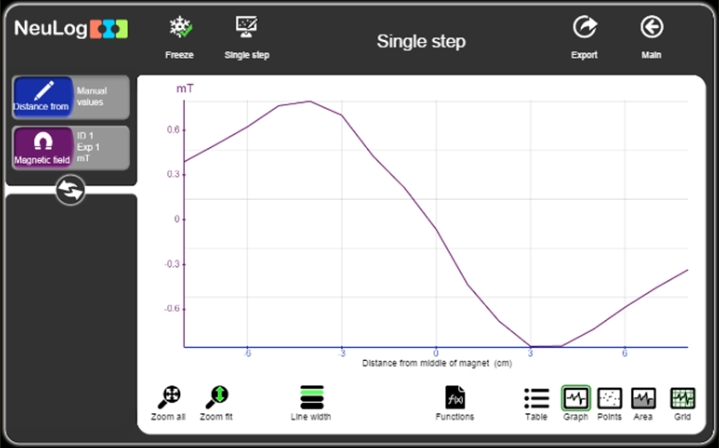
In this experiment, the magnetic field strength was measured at different locations on a bar magnet. This created a graph that has perfect rotational symmetry.
7. Charging a Capacitor
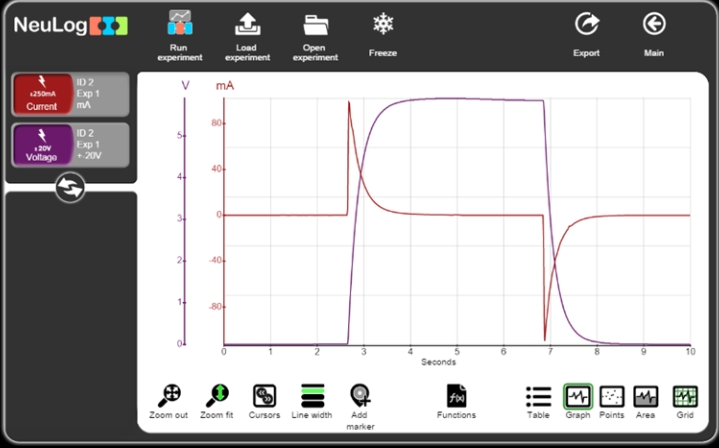
In this experiment, voltage and current were measured while a capacitor was charged and discharged. The current graph also has excellent rotational symmetry.
More to read – NeuBlog
- Projects using NeuLog sensors and AI
- Basic Sound Set and Sound experiments
- Basic Motion Set and Motion experiments
- Basic pH Set and pH experiments
- Published Research with NeuLog GSR sensor
- Basic GSR Set and GSR experiments
- Basic Heat Set and Heat experiments
- Neuron Logger Sensors
- Coding For Young Students – The Next Big thing
- Most Beautiful Graphs in Physics
- Light sensor brought to light